
Drill-down into a property location for a detailed breakdown of its risk and resilience profile.
Quick Tip: Check out this article if you haven't uploaded your properties yet!
After getting a sense of your data composition in the Data Manager and its overall performance within the Multi-asset View, you'll likely be ready to hone-in on one - or several - properties within a given portfolio. 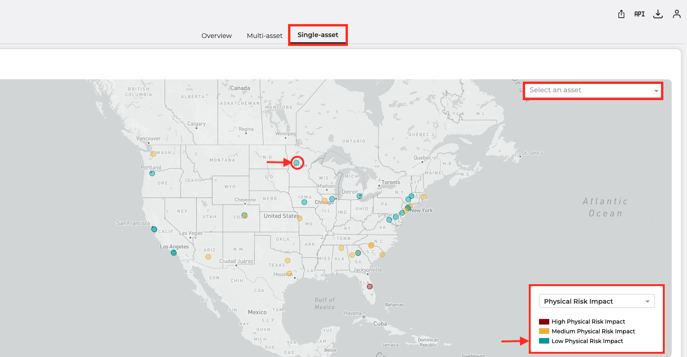
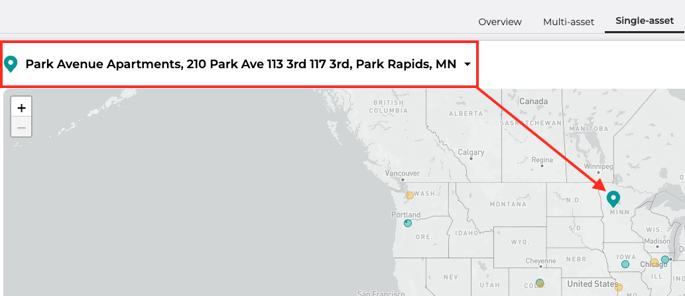
To get started, you can either select an asset from the dropdown list or interactive map.
Quick Tip: Clicking a property name in the Benchmarking Table within Multi-asset View will prompt the Single-asset View with that asset selected and analysis displayed!

You can toggle your map between Physical Impact and Resilience-Adjusted Impact risk profile before determining your selection.

If you'd like to compare one - or multiple - assets to another, utilize the "Add to Comparison" button that will appear when you've selected an asset (or created a filter).
This feature allows you to "jump" between single-asset and multi-asset analysis without having to switch "Views."

The Comparison View will appear once assets are "added," with the number of properties or groupings indicated to the right.

Note: The Comparison View behaves just like the Multi-asset View without the Data Filter Tool. Here, whatever you've "added" to the comparison, be it entire filters with multiple underlying assets or standalone properties, will appear for toggling.